Local market stats
Every home on the portals across the whole CM1 outcode, all agents, all six sectors. 685 listings, read on one day.
Autumn 2026 · figures read 13 October 2026
The middle home for sale, 13 October. It was £385,000 on 3 September.
Up £15,000, or 3.9%
The middle asking rate, 13 October. It was £399 on 3 September.
Up fifty pence
Six weeks apart, the same district, the same method. The headline went up £15,000 and the price of a square foot went up fifty pence. What changed is what is for sale, not what it costs: flats fell from 33.4% to 31.4% of the listing book, so the typical listing got bigger.
The market today
What this count cannot see. It counts listings still visible on 13 October 2026. Anything that came to market in August and sold and came off before October has left the dataset, so every figure here leans towards the homes that are still standing.
Why these months cannot be set against the summer edition. Each pull only sees stock still visible on its own read date, so the further back a month sits the more of it has already gone. The September edition put July at 165 listings; this one puts the same July at 110. That is six more weeks of attrition, not a revision.
Asking prices
The average asks £73,000 more than the middle, because CM1 holds city-centre flats and Roxwell country houses inside one postcode.
Middle asking priceacross 681 listings on 13 October 2026
Average asking pricepulled up by a long tail at the top
The £15,000 is mix, not value. The middle ask rose 3.9% in six weeks while the middle asking rate per square foot rose from £399 to £399.50. Flats fell from 33.4% to 31.4% of the listing book over the same six weeks, and the middle listing is sensitive to that. It is not evidence that homes repriced upward.
Sold STC counts are as at 13 October 2026. The sector names describe the settlements each one mostly covers, read from the addresses themselves. They are postal sectors, not wards or parishes, and there is no CM1 5.
The six dearest listings in CM1: The Street, Roxwell CM1 4LB at £3,250,000; Lodge Road, Writtle CM1 3HY at £2,650,000; Chelmsford Road, High Easter CM1 4PY at £1,975,000; Skreens Park Road, Roxwell CM1 4NL at £1,750,000; and two on Woodland Way, Edney Common CM1 3FF at £1,750,000 and £1,650,000. Every one is a detached house in CM1 3 or CM1 4. The city itself has nothing on the market above £1.5m.

What a pound buys
The middle listing in CM1 asks £399.50 a square foot across 973 square feet. A flat asks £381 and a semi-detached house £415, which is a spread of 9% between the cheapest and dearest type of home in the district.
Price per square foot is the asking price divided by the floor area. It compares two homes of different sizes without the bigger one always looking dearer. 488 of the 685 listings publish a floor area, which is 71% coverage, the same as the summer edition. The middle listing sits at £399.50, the average at £414, and 80% of them fall between £314 and £515.
The 42 Beaulieu Park listings that publish a floor area ask a middle £392 a square foot, which is 2% below the district rate, across a middle home of 1,574 square feet against Chelmsford's 973. The gap inside CM1 6 is 62% more house, not a premium rate for it.
Four years
That is 2.1% across four years, before inflation, and the line has held a £12 band the whole time. All the growth in this series landed between 2020 and 2022, in two moves of 6.2% and 6.8%.
2022 to 2026: +2.1%, before inflation.
PropertyData's £/sq ft series for CM1, each point dated October. Year on year: +6.2% in 2021, +6.8% in 2022, +1.2% in 2023, −1.9% in 2024, +1.9% in 2025, +0.9% in 2026. The 2026 point is the newest reading and may fill in further, which is why this shows four years rather than the last figure. This series re-dates to the month it is read in, so these points are October where the September edition's were September. It is the same annual series read six weeks later, not a continuous monthly line.
Two different measures, never merged. This series sits above the £399.50 asking rate above it, which says it is built on a different population of homes, most likely completed sales rather than live listings. Both are reported here. Neither is converted into the other and they are never drawn as one line or on one chart.
What it says to a seller. The market is holding a plateau rather than falling, and that plateau has now held across two editions read six weeks apart. Anyone waiting for a rebound before they move has been waiting since 2022.
What homes actually fetch
746 registered sales in CM1 carry a floor area matched from their energy certificate. Across the twelve months to July 2026 the middle month never left a £412 to £452 band, and 2026 so far reads £428 a square foot across 385 sales.
Middle achieved rate by month of registration: £426, £429, £437, £452, £413, £412, £429, £428, £428, £421, £429, £428. Bars are drawn from a £400 baseline so the month-to-month movement is visible; the whole range of the chart is £40 a foot.
August 2026 is left out of this chart on purpose. Land Registry data for CM1 stops on 21 August, so August is 27 sales across 21 days and seventeen of them are semi-detached houses, a type that is running far above the district rate in that small sample. A part-month of one house type is a composition effect, not a price move, so it is not drawn and its rate is not quoted. September does not exist in the data at all.
Days on the market
Counted for each listing on its own, from the day it was advertised. It measures time since listing for homes still showing on 13 October 2026, so quick sales have already left the figures and every number here leans towards slow movers. It is a picture of what is standing, not an answer to how long a sale takes. The quickest live listings already flagged sold subject to contract went in single figures: Cramphorn Walk CM1 2RE at £325,000 in 5 days, Weymouth Road CM1 6LP at £525,000 in 6 days and Coombe Rise, Broomfield CM1 7DG at £375,000 in 7 days.
The listing mix
Listings: 215 flats, 208 detached, 191 semi-detached and 71 terraced, from all 685. Housing stock from census output-area counts across the 271 output areas in CM1. The two are different populations, so read this as a signal about turnover rather than a like-for-like comparison. The flat over-representation has eased from 5.4x in September to 5.1x, but the shape is unchanged.
Chelmsford's apartment stock is turning over hard and clearing slowly at the same time. For a vendor with a house, most of the visible competition is not competing with them.
Months of stock is how long the homes for sale would take to clear at the current rate of sale. Two of the six sectors are now rated buyer's markets, where in September only CM1 1 was. The other four are rated balanced.
Sold prices
27 sales in CM1 carry a registration date inside the autumn window, at a middle of £430,000. Read the box below before you quote that: it is 1 to 21 August and nothing else.
There is no September, and August stops on the 21st. Land Registry data for CM1 runs 16 February to 21 August 2026, because registration lags roughly seven to eight weeks. The window's registered sales therefore cover 1 to 21 August and none of September at all. Nobody can quote a registered September sale in Chelmsford yet, and this page does not estimate one.
Twenty-seven sales across twenty-one days, seventeen of them semi-detached, is a 21-day sample and not the window's outcome. The month counts are a measure of paperwork, not of selling, which is why August is not drawn as a line or a bar anywhere on this page.
Across the whole six-month pull there are 327 registered sales at a middle of £400,000, ranging from £81,250 to £1,800,000, all classed old stock.
HM Land Registry price paid data. Floor areas are matched from the energy certificate rather than measured, so a rate per foot is only shown where a certificate matched the address. All 27 registered sales inside the window are set out in the PDF.
How to read this
Middle means the midpoint: half the homes sit above it and half below. It describes a market better than an average, which one very large house can pull about.
The window for anything dated here runs 1 August to 30 September 2026, and it is closed. Registered sale records only reach 21 August.
Under offer is a live count on 13 October 2026 of homes showing as sold subject to contract. No portal records the date the flag went on, so nobody can turn it into a tally of August and September.
Days on the market here is counted for each listing on its own. The figure some tools publish for this is months of inventory multiplied out into days — three CM1 sectors return the identical 304 on that measure — which is stock against sales rate rather than how long a sale takes. It is not used on this page.
Sectors, not neighbourhoods. CM1 has six live sectors and no CM1 5. The names describe the settlements each one mostly covers, taken from the addresses. They are not wards or parishes.
Two editions, one method. Where a September figure is quoted for comparison it is the summer edition's own published value, read on 3 September 2026. Nothing from that edition has been recomputed.
Nothing in this list has been filled in with an estimate.
Registered sales for September 2026, and for 22 to 31 August. They do not exist in the data yet. Registration lags roughly seven to eight weeks and the CM1 record ends on 21 August.
When anything went under offer. No tool returns dated under-offer transitions for the whole market. What exists is a one-day snapshot.
Which agent holds any listing. The listing records carry no agent name, so no home on this page is attributed to an agent from that source.
What homes achieved against what they asked. The sold and listing datasets cannot be joined address to address, so no ratio of the two is published here.
Floor area for 197 of the 685 listings, 29% of them. It is not published on the portal record, so every rate per square foot on this page is computed from the 488 that do publish one.
Whether October is a full month. The read date is 13 October, so the 53 listings dated to October are a part-month. They are excluded from the window and shown only as context.
PDF, ten pages. The district picture, every sector, price per square foot with the type splits, the four-year trend, achieved rates, time on the market, the listing mix and the registered sales, laid out to print.
Our own listing
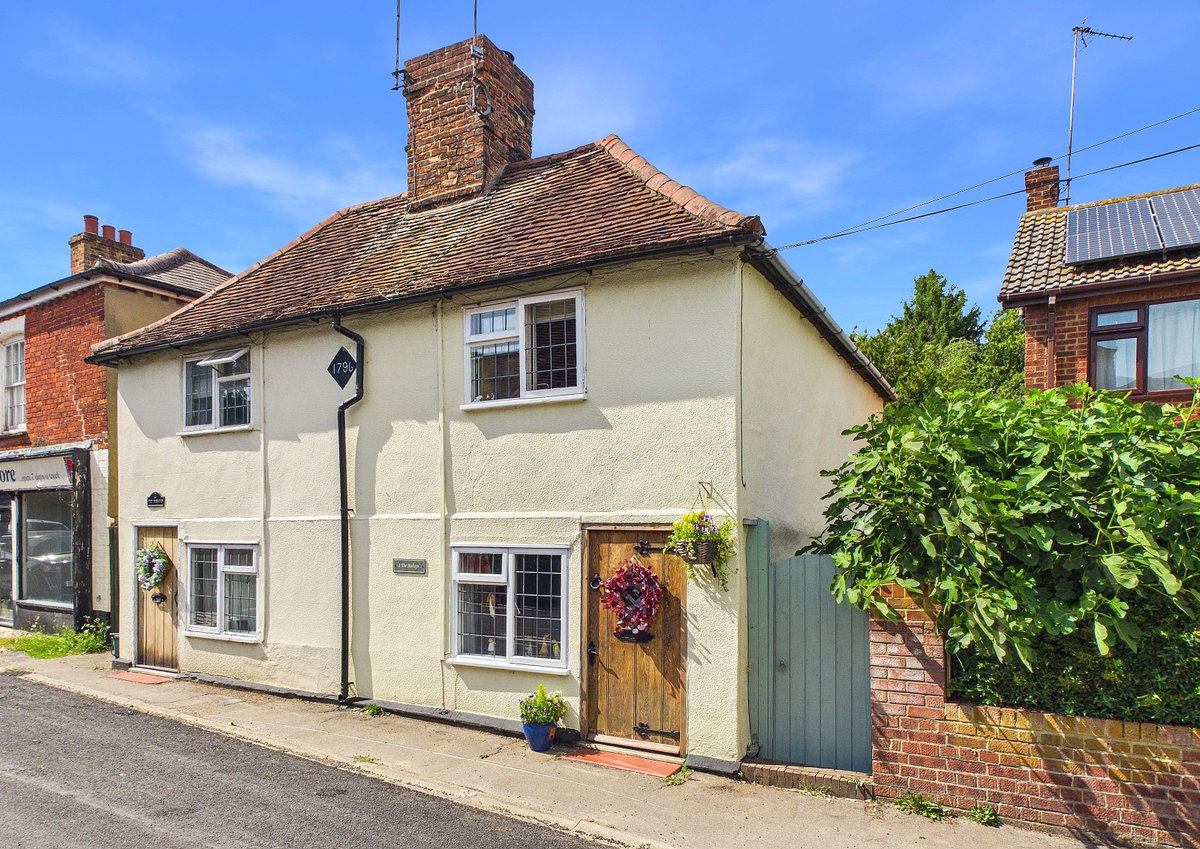
The figures above cover every agent's stock in the district, not ours. For the avoidance of doubt: Muvin has no completed sale on its books in CM1. The nearest records are in CM2 and CM3. What we have in the district is the home below, in Roxwell.
Built in 1796 and partially Grade II listed, with an inglenook fireplace, exposed beams and a walled courtyard garden. Chelmsford is a short drive from the village. Shown as under offer on muvin.co.uk and flagged sold subject to contract on the portals, both checked on 13 October 2026.
See the full listing on muvin.co.ukPrice and status as shown on muvin.co.uk on 13 October 2026. The summer edition of this report also carried a second Roxwell home at CM1 4PD; its page on muvin.co.uk no longer resolves as of 13 October 2026, so it is not shown here. A two-bedroom terraced home at CM1 4PD is on the portals at £350,000, but the portal record carries no agent name, so this page does not claim it.
Your own home
These numbers describe 685 other homes. Yours has its own size, its own condition and its own street, and in a district where the rate per square foot runs from £345 to £454 depending on the sector and the kind of home you are standing in, those things decide the price. If you are weighing up a move in Chelmsford, ask and we will come and give you a figure for your own address, with the homes it is built on set out beside it.
Courtney Heelis has your name, your address and your number, and she will be in touch to arrange a time.
A message to her should also have opened in your email program, already filled in. If nothing opened, or you would rather chase it yourself, email courtney@muvin.co.uk or call 01279 600567.